As I wanted to implement a web-based collection of health-related data, I needed to extend the run-with-data website with a login option, which gives the user access to different forms that can be filled out before and after a run. The information input in these forms should then be inserted into the Postgres Supabase database, which I can then fetch and analyze locally. Keeping the structure of an HTML/CSS-based website lacking a backend meant that some JavaScript had to be included to add the logic. Again, I’m not interested too much in web-dev and don’t want to go into detail on the precise implementation (which was nevertheless mainly the output of an LLM). In a nutshell, I’m using a bunch of functionalities of the Supabase JavaScript Client Library for handling different processes, including user authentication (sign-in and sign-out), user authorization, and the insertion of data collected in the web form into the database. To me, the implementation was unexpectedly straightforward. Without any JavaScript knowledge, I could understand the code proposed by ChatGPT by going through the docs of the Supabase JavaScript Client Library. However, as any (honest) vibe-coder, for fast debugging, I was completely reliant on ChatGPT as well.
To my surprise, I got a working web-app with way fewer lines of code than I had expected, as I envisioned, e.g., the authentication part to be way more elaborate. More information on the authentication provided by Supabase is given in the ‚Supabase Auth: Build vs. Buy’ article, the Auth docs , and a guide on Supabase authentication . One should, however, be aware that the former two sources are provided by Supabase, hence, the article is (obviously) heavily biased. A more critical review of different auth solutions is given in this blog post .
Security-wise, I trusted Supabase and followed the ‚good practice‘ of implementing row-level security (RLS) for all public tables. In this regard, however, I should point out that I don’t know any better. As the worst case scenario I can think of is a data leak or the ‚theft’ of my data, I consider this not to really be a disaster (although it is partially health-related data). Therefore, to this end, the implemented solution is sufficient for my current use case, which is a web-based collection of my own data for local analysis at a later point in time. Given that I might want to extend the functionality, e.g., by including a real-time data analysis and its visualization, an (extensive) re-structuring will eventually be needed, mainly given by the fact that I’ll have to set up a backend. Furthermore, if I ever deal with more users, data security and privacy become obviously important.
By adapting the style (I am using the ‚Future Imperfect‘ template from HTML5 Up), within a quite short period of time (a few days while working on it only in the evening) I finally got to a point where I was happy with the appearance (at least on a phone and partially on a laptop) as well as the website’s functionality. Having a working website leads to the, in my opinion, way more interesting part of this work, i.e., the data schema, which builds basically the backbone of the whole project. As the ‚garbage in, garbage out‘ concept applies to any data science undertaking, this part is particularly important. No matter how nicely the data analysis might be implemented, if the collected data is garbage, the data analysis will provide a trashy output. In this sense, ‚garbage‘ implies flawed data, which can, e.g., be biased, incomplete, or poorly defined. Since I was still battling a tonsillitis (by this time already for 3 weeks (!!!) due to a mix of bad luck, poor personal choices, and incompetent doctors), I have had plenty of time to think about the data schema.
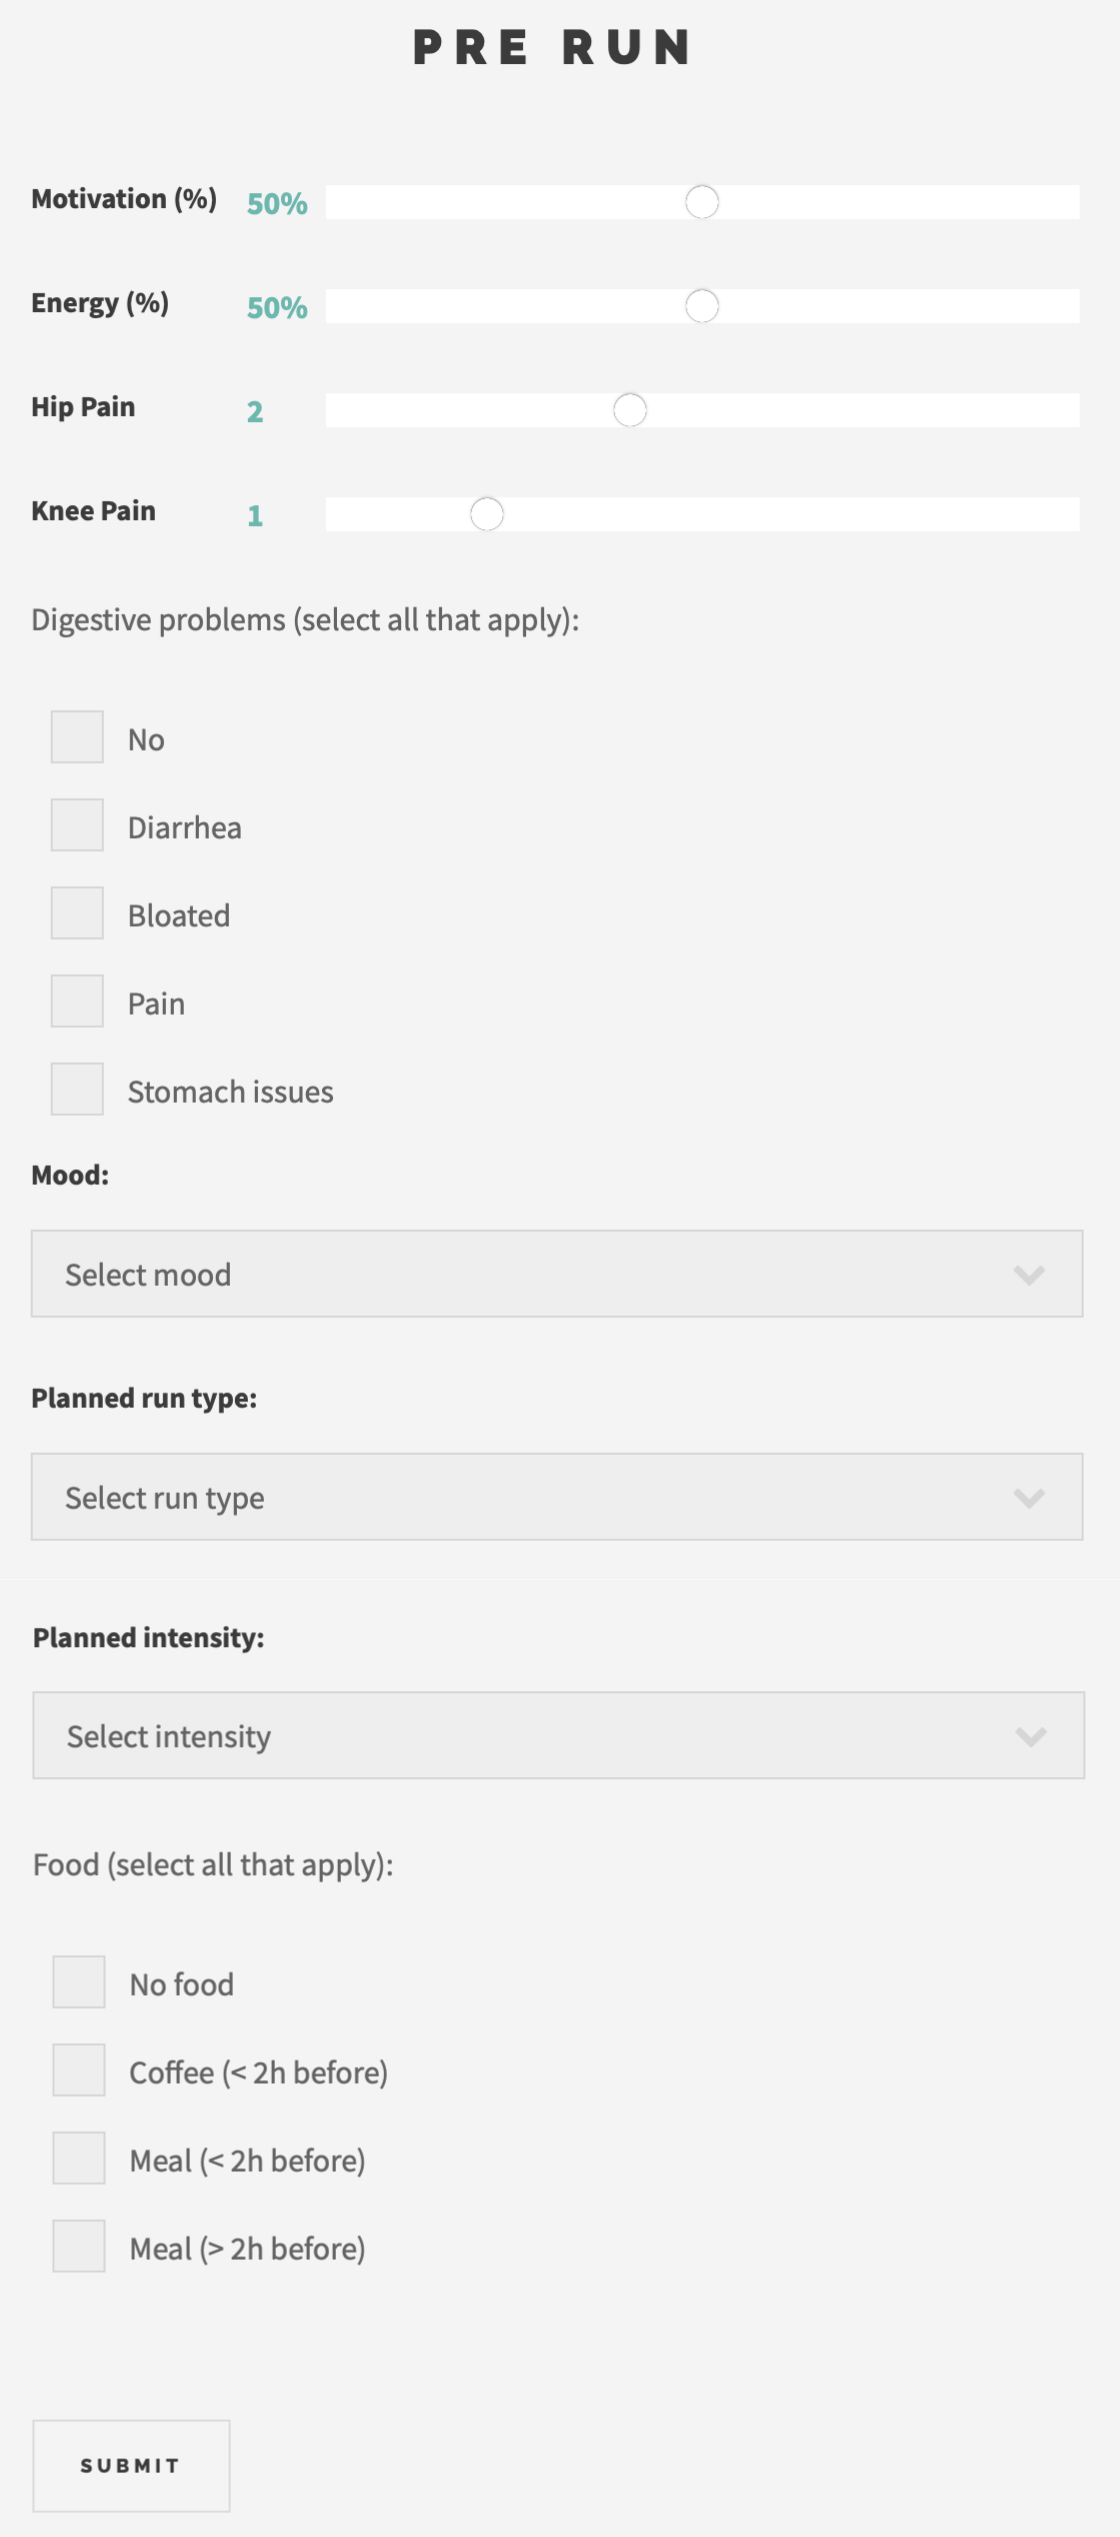
I decided to set up two forms, i.e., 1) Pre run and 2) Post run, with the former shown exemplarily (as displayed on the website) in the image on the right/ below. This lets me obtain data in two formats, i.e., as an integer, obtained from all sliders, and as text, obtained from the tick boxes and the drop-down options. Each data set is stored with a time stamp, which allows me to build a full data set of each run consisting of the pre-run data, the run data obtained by my Garmin watch, and the post-run data. My aim is to be able to analyze a bunch of questions. To give some examples, among others, I’d like to evaluate how my motivation and energy level before a run correlate with my performance, how my hip pain (and since I’m approaching my thirties, I also directly included knee pain) before a run evolves throughout the run, how my digestive symptoms before a run influence my performance and how they evolve during the run, how my food choices influence my digestive symptoms and my performance, and many more.
I think that the answers to these questionnaires should cover the data I need to answer these questions. By that, as soon as I’m healthy and able to train again, I’ll start to fill out the forms and do a first evaluation after two weeks. On the one hand, I’d like to check whether the form of the collected data allows for the intended analysis. On the other hand, if I feel like answering any of these questions is inconvenient, or I realize that something is missing, I can adjust the forms to have an updated and improved version for the remaining marathon preparation. For example, in the post-run form, I included the rating of the intensity I felt during the run in two ways: by a slider where I can give it in % (from 0 to 100) and by a drop-down menu where I can choose between low, intermediate, and high. Right now, I don’t know exactly which one I’ll prefer.
Since I need at least two weeks of training data before being able to do the first data analysis, the next post will cover my plans for the marathon preparation, which were heavily altered due to my unfortunate sickness-prone start of the year.